Illus. 6
The next time you listen closely to a sound, think about this: you are actually hearing a composite of different pitches! The brain distinguishes sound sources based on the specific relationship between these pitches. A sound's total collection of pitches and their relative strengths constitute its spectrum.
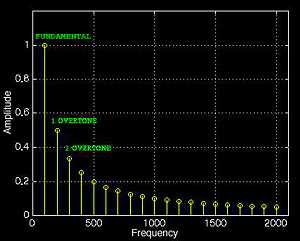
Individual tones from a single instrument or a vocalist have a harmonic spectrum with a completely unique structure. A harmonic spectrum consists of a fundamental tone and a number of overtones that are spaced according to the harmonic overtone series. If the fundamental tone is 100 Hertz (100 cycles per second), the overtones will be 200 Hz, 300 Hz, 400 Hz, etc. The relative strengths of the different overtones determine the timbre of the sound. Musical instruments have different timbres, as do human vocal chords.
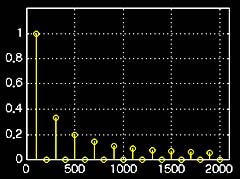
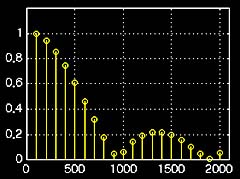
A spectrum may be rendered by means of a spectrogram. Below you will find such a spectrogram, where frequency is plotted on the x-axis and the fundamental tone and overtones are represented as "columns" of different heights, indicating their relative strengths.


More complicated sounds have more involved spectrums, and the timbre may also change over time.
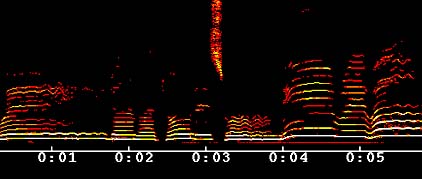
An overview of a sound's spectrum and timbre may be represented by a sonogram. Time runs along the x-axis, frequency lies on the y-axis, and the strength of the harmonic tones is indicated by shades of gray or colors:

Click on the sonogram to listen to the sound. Can you trace the relationship between the sound and image?
Deep harmonic tones are in the lower part of the sonogram, and the high tones are in the upper part. Whispering sounds are represented as "cloudy areas," while single tones are shown as a group of horizontal lines that indicate the fundamental tone (bottom) and the overtones. �<�/�B�O�D�Y�>� �<�/�H�T�ML>